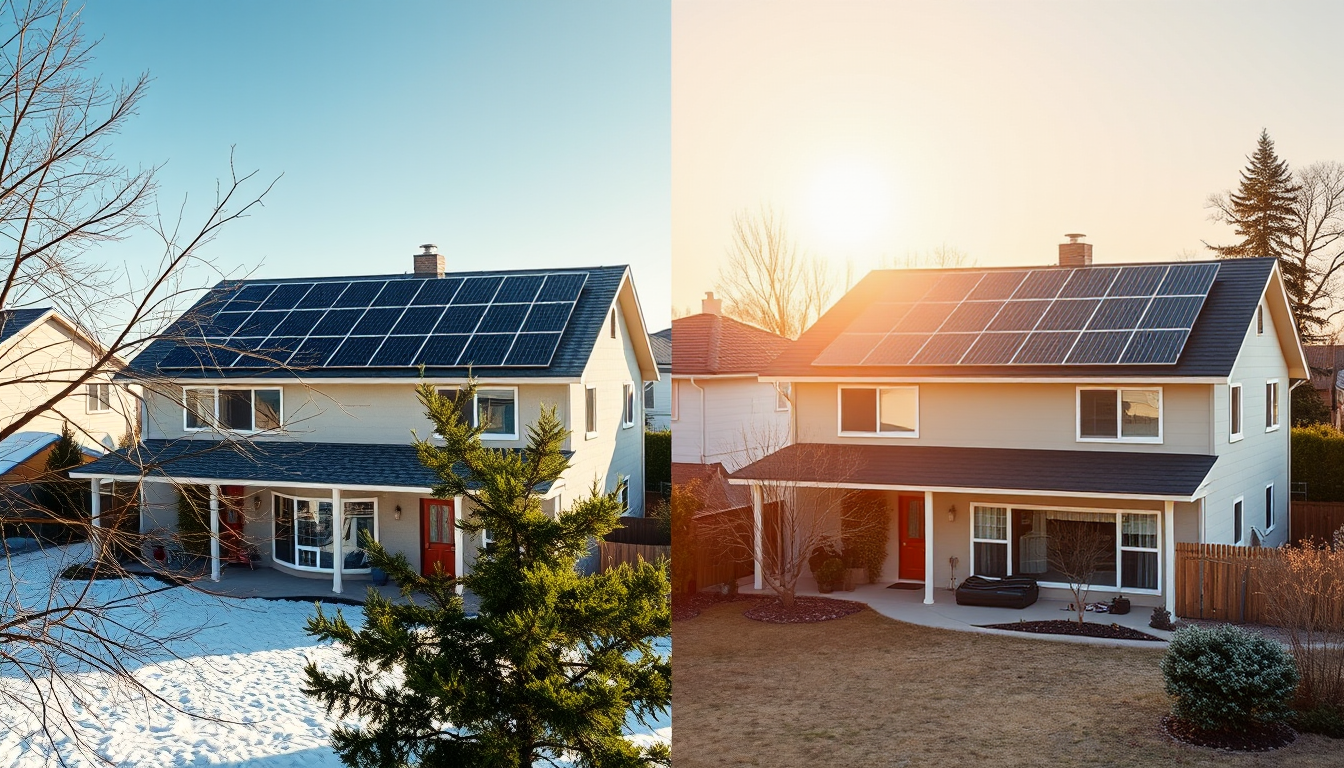
Do Solar Panels Actually Work in Winter? (The Numbers Most People Guess Wrong)
Winter output drops because of shorter days and a lower sun, not cold. Cold actually helps panel efficiency. Here are the real numbers by climate, plus how to size for the seasonal dip.
Ask a homeowner to guess what their solar system does in January and you will usually get one of two answers. Either "it basically stops for the winter," or "it does the same thing as July, just with snow on it."
Both are wrong. And the gap between the guess and the real number is exactly the kind of thing that decides whether you oversize, undersize, or skip a battery you actually need.
So let us clear it up with numbers.
The short answer
On a clear January day, a typical 6 kW residential system in the US produces somewhere between 12 and 24 kWh, depending on where you live and the local sunshine hours (source: Green Energy Calculators, NREL PVWatts data).
That is a real, usable number. It is not a system lying dormant for three months. What actually happens is this: the average US system produces roughly 50-70% of its summer output in December. That dip is real and predictable, but it is driven by daylight and sun angle, not temperature.
The part everyone gets backwards: cold is good
This is the counterintuitive bit, and it is the one worth internalizing.
Silicon solar cells are semiconductors. They are rated at 25 degrees Celsius (77 F), which is called standard test condition (STC). When the panel surface gets hotter than that, which happens every single summer afternoon, it produces less. A typical crystalline panel loses about 0.3% to 0.5% of its output for every degree above 25 C (source: 8MSolar). A 400 W panel can be making only 360 to 370 W on a hot July afternoon.
Now flip the math to a cold, clear February day. A panel running at 5 C (41 F) is about 20 C below STC, and that is worth roughly a 6 to 10% efficiency boost over the nameplate rating. In very cold conditions, panels can produce 5 to 7% more power than their rated output.
The practical takeaway: peak-sun hours, not temperature, is what makes winter output lower. The panels are actually performing better per hour of sun in the cold. There are just fewer of those hours.
In December, Boston averages about 2.4 peak-sun hours a day compared to 5.8 in July. A 6 kW system at 80% efficiency makes about 11.5 kWh on a December day versus 27.8 kWh in peak summer. Same physics. Fewer hours.
Where you live changes everything (up to 3x)
Winter solar is not one number. It is a range as wide as the country.
According to EIA data, average daily solar irradiation in December runs from about 1.5 kWh/m2 in Maine to over 5.0 kWh/m2 in Arizona. That is a nearly 3x spread, and it maps almost directly onto what your system produces each month (source: NREL PVWatts, EIA 2026, via Green Energy Calculators).
The three tiers in practice:
- Sun Belt (Phoenix, much of Texas and Florida): Phoenix averages about 5.2 peak-sun hours even in December. A 6 kW system there produces roughly 850 to 900 kWh in a winter month, which is close to what the same system does in a summer in the Northeast.
- Midwest and mid-Atlantic (Chicago, Columbus, Philadelphia): around 2.5 to 3.2 peak-sun hours in December. A 7 to 8 kW system makes 400 to 550 kWh monthly, enough to cover base loads but not heavy winter heating.
- Pacific Northwest (Portland, Oregon): persistent November to February overcast skies suppress output beyond what latitude alone would predict. Portland's December average is about 1.8 peak-sun hours. An 8 kW system might manage only 300 to 350 kWh in December.
So if you are in the desert Southwest, your winter bill is barely dented by the seasonal drop. If you are in the Pacific Northwest, the cloud cover is doing more to your output than your latitude ever will, and winter self-sufficiency almost always points toward a battery.
Real owner-reported data backs the Sun Belt picture. In January 2026, Southern California homeowners reported an 8.4 kW system doing 765 kWh (even with nine below-average days), an 8.2 kW system hitting 906 kWh, and a 9.6 kW east-facing system producing 722 kWh in its first winter month. The typical January drop in Southern California is 20 to 35% versus summer, with inland areas dropping only 20 to 22% thanks to clear skies (source: US Power Solar, January 2026 owner reports).
Snow: usually a non-issue
A light dusting that melts or slides off by mid-morning barely touches your monthly total. A heavy accumulation sitting on the panels for three days is effectively the same as full shading. Output drops close to zero until the array clears.
If you live above 40 degrees latitude, steep pitch matters. Panels on a roof pitched 35 degrees or more shed snow faster than low-slope installations. Installers in northern climates routinely tilt panels steeper than the latitude-optimum angle specifically to improve self-shedding in winter. If you are snow-country, this is a design conversation worth having before install, not after.
How to size for the winter dip
The standard advice, size the system to cover 100% of your annual electricity use, quietly accepts a seasonal pattern: a deficit in winter, a surplus in summer.
That trade works beautifully when your utility pays full retail net metering. Every kilowatt-hour you overproduce in May and June earns a credit that wipes out the December bill. The annual picture is what pays for itself, not any single month.
The math changes when your utility pays avoided-cost compensation instead. If you get paid only 3 to 5 cents per exported kilowatt-hour rather than the full 10 to 18 cent retail rate, oversizing for summer export is a poor return. In that case the smarter move is to size closer to your winter baseline load and accept that you will buy some grid power in the darkest months rather than dump cheap excess in summer. This matters a lot for long-term payback, and it is a consideration that only makes sense once you know your actual winter production.
That is the real reason to look at your specific address. The seasonal split is not a national average you can borrow. It is a property of your exact roof, your latitude, and your local sun.
The honest bottom line
Solar works in winter. The cold actually helps the panels, the drop is driven by daylight and sun angle, and it is highly predictable year over year. But the size of that drop is deeply personal to your location, and it decides three things at once: how big a system you need, whether you want a battery, and which net metering strategy pays.
You do not need to guess where you land. Enter your address and see the actual sunshine hours for your roof, the panels that fit, and the projected yearly savings, broken down so you can see the winter months, not just the annual average. That takes a few minutes and costs $19 at https://solrscan.com.
SolrScan estimates are based on satellite imagery and public data. Consult a licensed installer for a site-specific assessment.